Machine Monitoring
The Avista Machine Monitoring System is designed to monitor the activity of multiple converting machines and record production and downtime information for each machine. All information can be accessed from the office or anywhere on the TCP/IP network on a real-time basis.
The system provides an unbiased account of every downtime helping to identify areas where maintenance should focus their efforts, training may be required, or procedures could be changed to minimize downtime. The production information serves as a benchmark for improvements as well as a motivational tool for production personnel.
The Machine Monitoring system consists of a Plant Floor Application, Front Office Application and Report Manager Application.
Click to view

Easy to Maintain
Click to view

Tracks all Performance Factors
Click to view

Simple implementation
Key Benefits of Machine Monitoring
- Allows supervisory personnel to monitor the entire plant floor from their office.
- Provides a real-time graphical representation of machine performance in terms of product produced for the current shift and a similar representation of machine performance for the previous shift.
- Displays total production for the current order in real-time. Tracks production by individual order number.
- Activates an output signal that prevents machine startup until a downtime reason is entered.
- Provides the ability to zoom in on an individual downtime occurrence shown on the graphical display and view details of the specific event.
- Graphically displays ten or more machines showing current up/down status, average speed in blanks per minute, current or last downtime with reason and comment.
- Prevents changes/modifications to data except under password control.
- Provides reports to track the performance of all monitored machines.
Plant Floor
The Plant Floor Application collects and displays production and downtime information for an individual machine through the use of data acquisition hardware, supplemented by manual entries by the Machine Center Operator. Real-time feedback relative to machine center activity is constantly available.
The application runs continuously (24 hours a day, 365 days a year) on a dedicated pc located near the machine. An operator can use the system to zoom in on an individual downtime occurrence and view the details of the specific event (i.e. start time, end time, duration, reason codes, etc.).
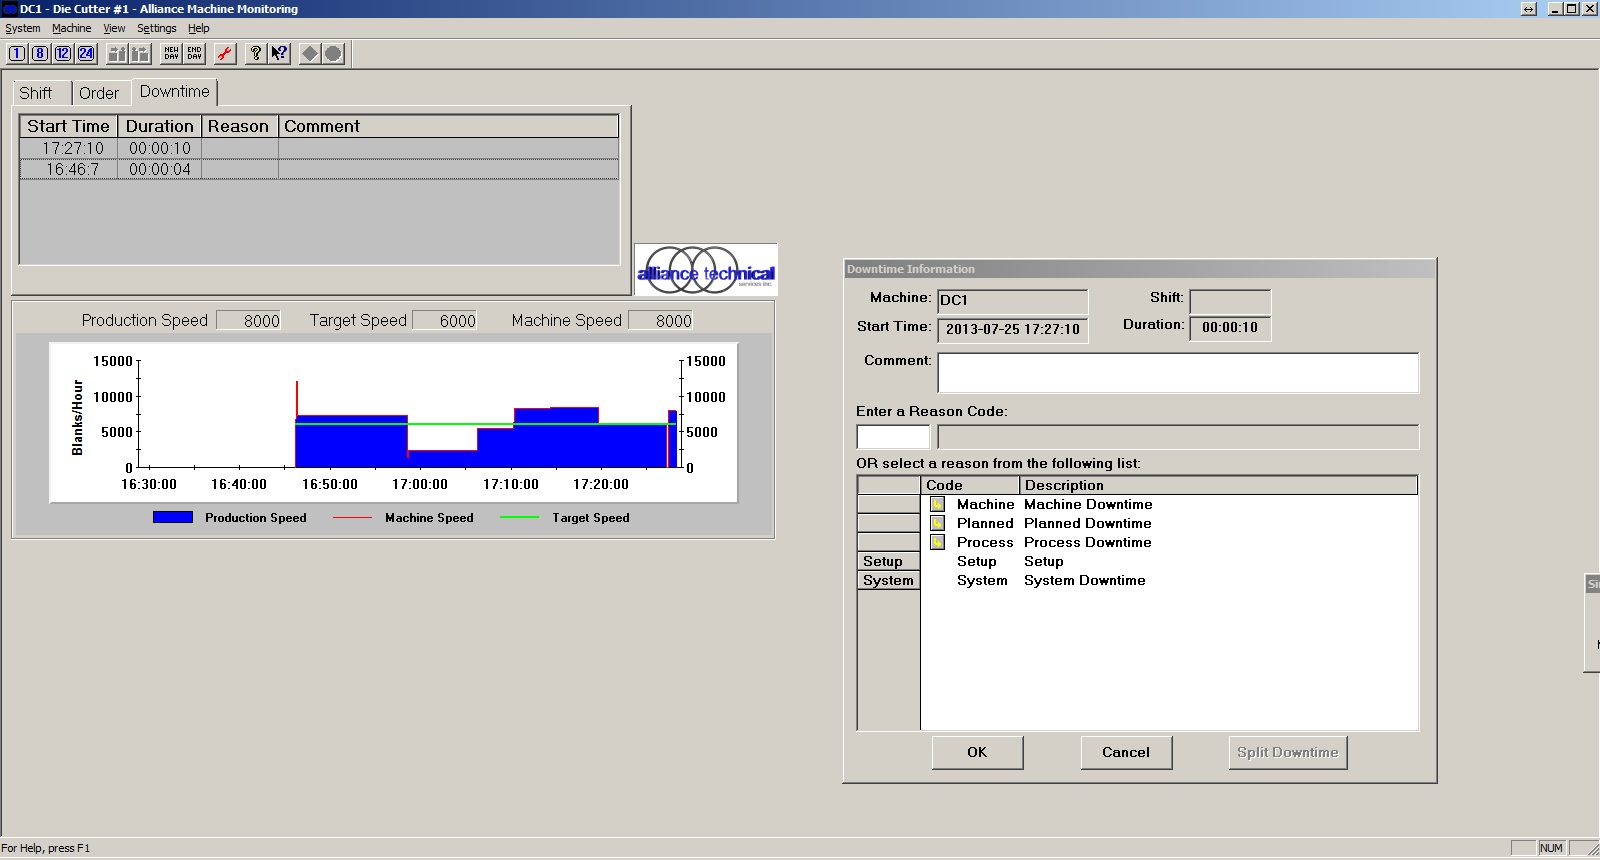
The Main Plant Floor Screen displays shift, order and downtime statistics for the machine. It contains a graphical display of the production speed, machine speed and target speed. Time frames for the graphical view include one, eight, twelve and twenty-four hour increments.
Starting/Ending an Order
A start order feature allows you to start running a new order on the machine. The end order feature allows you to stop running the current order on the machine. The corrugator must be stopped for you to start a new order or end an order.
Maintenance Override
A maintenance override feature allows an operator to override the system for maintenance. If you start and stop the machine during this maintenance period, the Machine Monitoring system ignores this activity. All time spent in Maintenance Override mode is logged to a single downtime named Maintenance Override. During Maintenance Override, the speed on the graph will remain at 0 and no production will be counted. This assures no false production is logged when repairs or maintenance are being performed on the machine.
Day/End Day
The New Day feature allows you to
begin tracking a new day of
information. It is used when the
machine is started up before its
scheduled start time on the first shift of
the day.
The End Day feature is used to end the
current day of information. It is used on
the last shift of the day when no shift is
coming in after.

Entering Downtime Events
When a downtime is sensed by the system, the Downtime Information Screen automatically pops up prompting the operator to select a reason code for the downtime event. The list of reason codes is developed specifically for each machine. If required, the Operator can further explain the reason for the downtime occurrence through the use of a free-form comment. The Downtime Information Screen displays the machine id, shift, time the machine went down and the duration of the downtime and lets you change reason codes and comments for the downtime event. Other downtime features include the ability to edit reason codes or comments for past downtime events and the ability split a current downtime event. The split is used if the machine is down, but is now down for a different reason. It will end the current downtime and begin a new one. The system automatically determines whether the machine is running (up) or not running (down) based on three time increment values for each machine.
"Minimum Reportable Downtime" - The amount of time the machine must be down before it is recorded as a downtime event. This value allows you to filter out insignificant downtime occurrences.
"Minimum Promptable Downtime" - The amount of time the machine must be down before the Plant Floor application will prompt for a downtime reason. "Minimum Reportable Uptime" - The amount of time the machine must be up before the system will end a downtime event.
Front Office
The Front Office Application graphically presents the status of one or more monitored machines on a real-time basis and allows individuals to view down time information for each machine center from anywhere on the network. Multiple windows can be open concurrently so all pertinent information can be seen at a glance.
Machine List View
The Machine List displays the Machine
ID and Description for all machines
that are configured to run (see Figure
3, lower left). Each machine is color
coded to indicate machine status.
Green – the machine is running
normally.
Yellow – the machine is running below
the target speed.
Red – the machine is not running.
Gray – the machine is not connected to
Front Office (there is no data).
Summary List View
The Summary List displays order information for all machines configured in the machine list view. Color codes indicate machine status. Information displayed includes Machine ID, Description, Order Number, Lineal, Production Speed and Machine Speed.
Machine Detail View
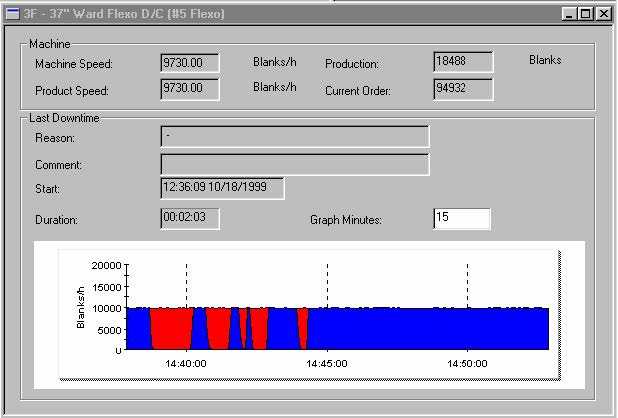
The Machine Detail View displays machine and production speed, real time lineal and information for the last reported downtime on the selected machine. You may open several machine views concurrently.
Configurations
The Front Office application provides a mechanism to configure machine specific parameters including reporting information, downtime reason codes, passwords, shift start time and durations.
Password Control
To preserve the integrity of data and control changes, security level passwords can be assigned to each data field. The system utilizes three levels of password protection: Plant Manager, Supervisor and Maintenance Override.
Report Manager
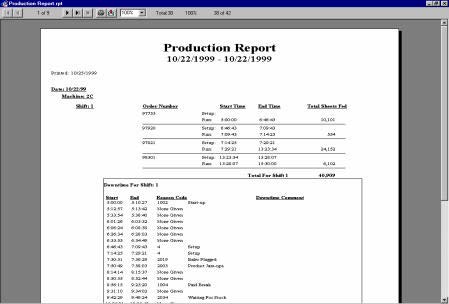
The Report Manager offers a variety of reports analyzing production and downtime information for each machine and shift. All reports can be customized to meet a plant's specific needs. Standard reports include:
Daily Downtime Events: This report lists individual downtime events, grouped by date, machine and shift. The start time, duration, description and applicable comments are shown for each event.
Downtime Occurrences by Shift: This report displays frequency and time by down time reason code grouped by date, machine and shift. The description, total occurrences and total time are shown for each downtime reason code logged for the machine during the shift. Total up time, total down time, up time percent, total production and average speed are shown on a per shift and per day basis for each machine.
Top Downtime Reasons by Occurrence: The report lists the top 20 reasons for down time based on the frequency of each downtime reason code logged for the machine during a specified period. The description, number of occurrences and total downtime are shown for each reason code. A separate chart presents the information in bar graph format with each bar subdivided to show the duration of each individual event in the category. Total downtime, total occurrences and average time per occurrence are included for each bar on the chart.

Summary
The Avista Machine Monitoring System is an essential tool for keeping your entire plant informed of real-time production information and downtime events. All users including Production Crews, Supervisors, Maintenance Staff and Front Office Personnel can quickly access both downtime and production information for each machine center at a glance. The systems graphical displays and reports provide a benchmark for production improvements and help identify areas where maintenance should focus efforts, training may be required or procedures could be changed to help minimize downtime.
All machines experience unscheduled downtime. The Machine Monitoring System will help identify the reasons for and help quantify the cost associated with this downtime. It will also help determine if each machine center is meeting established production goals and identify ways to better utilize the running time of each machine.
Still have questions? Need more information? We should talk.
Hi, my name is Mark Gartrell with Amtech Automation and we would love to hear from you! If you're considering building a new plant, looking to improve your processes, or need to upgrade to a better solution, I hope you'll give us a call at +1 952.949.0594 to set up a time where we can connect in person or by phone, or email me directly at mgartrell@avistasoftware.com.
For information about how to contact our other employees, please visit our Contact Us page.

Converting Management Solutions
PACS Converting Scheduling
The Planning and Converting Scheduling (PACS) application from Avista is a completely automated plant planning...
Read MorePlanning Board
This intuitive application generates a true pull view of converting plant workflow using a Gantt Chart format that provides...
Read MoreConverting Tag Manager
The Avista Converting Tag Manager provides your plant with the real-time ability to print both work-in-process...
Read More
